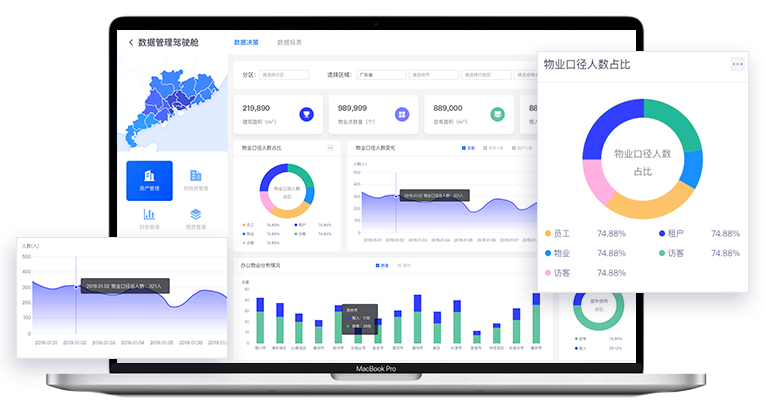
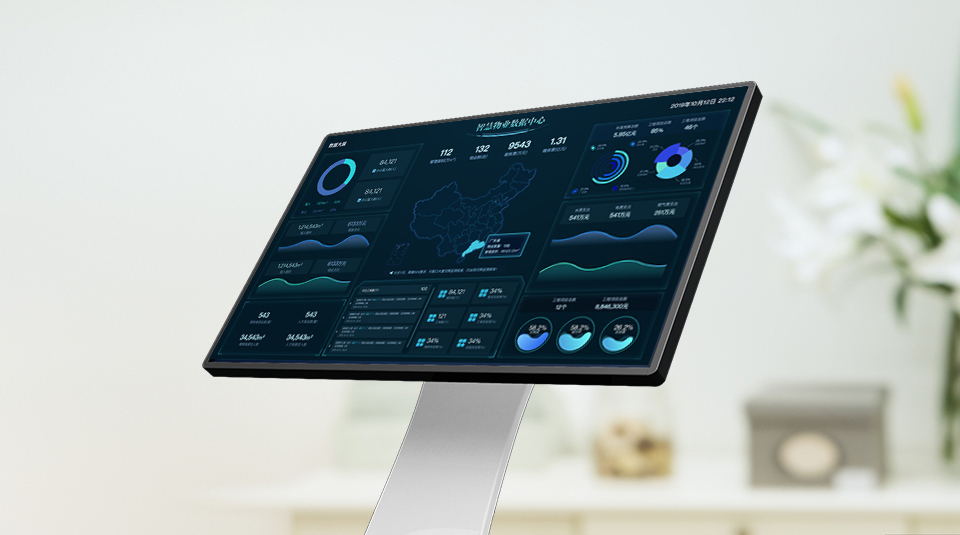
Visualizes abstract data in terms of spaces, organizations, service resources, operation and maintenance by closely integrating service system data, to reflect development, change and trending.
Enables creation of both static data charts and dynamic dashboards. Quickly and accurately develops dedicated dashboards to show summary of specific indexes for decision-making while maintaining analysis library.
Helps business management report data to the board of directors for collective presentation of performance of various tasks and visualization of key operation indicators.


